ABOUT
Our Story
Finances
LOCATIONS
WORK WITH US
Join Us
DATA
TOOLKITS
Photos
Videos
Presentations
Signs
Here at Concordia, we compost.
We speak with data.
0
%
Overall waste reduced per person since 2016
0.1
annual composting since 2016
0
/
0
less contamination in compost bins since 2016
LATEST GRAPHS
Use the green arrows to navigate between our latest graphs (Last updated: 11/02/2020)
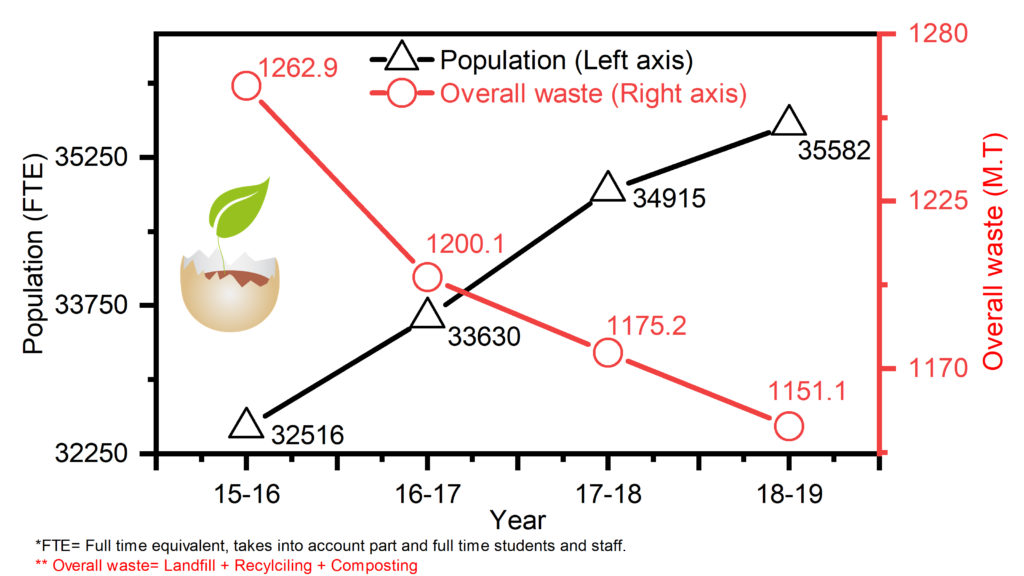
Weight of total waste collected at Concordia University
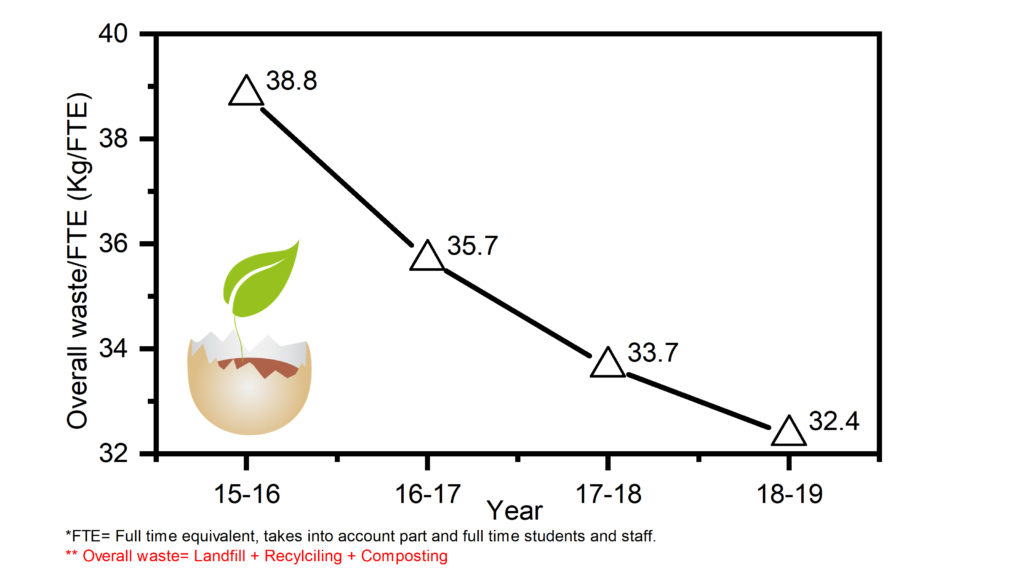
Overall waste per Concordian
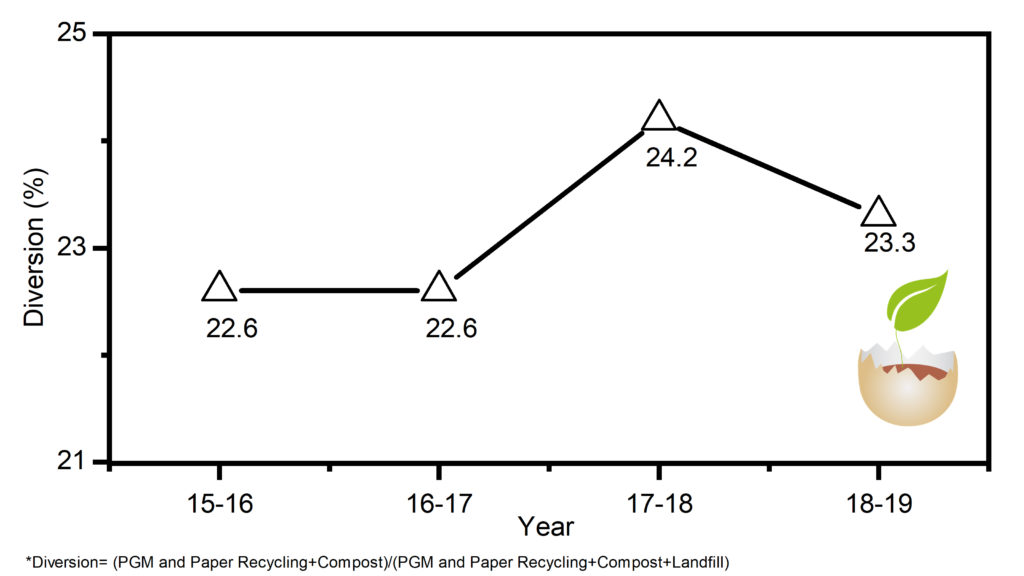
Diversion rate at Concordia University
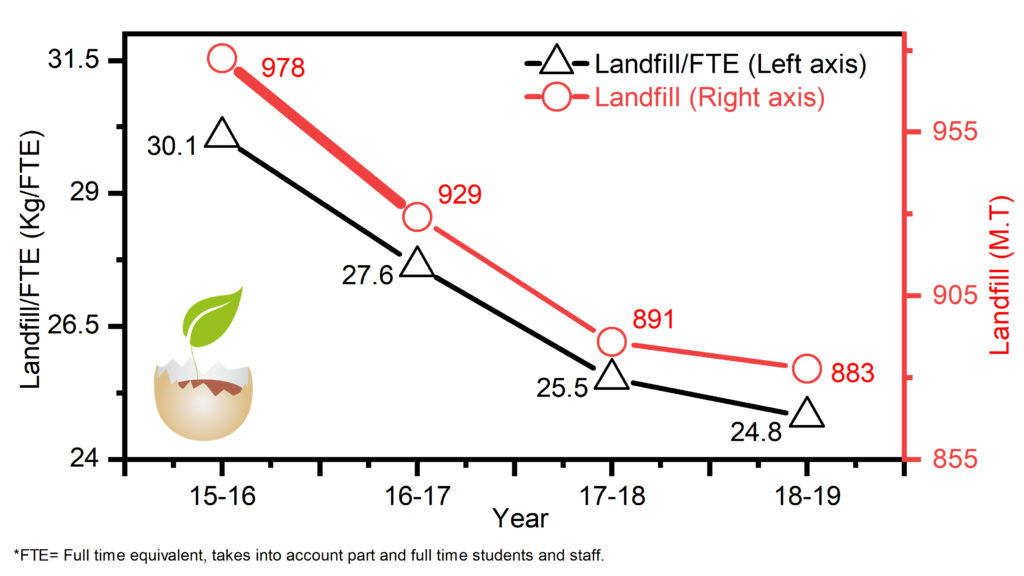
Weight of landfill waste in absolute values and normalized by population at Concordia University
Weight of organic waste collected in compost bins in absolute values and normalized by population at Concordia University
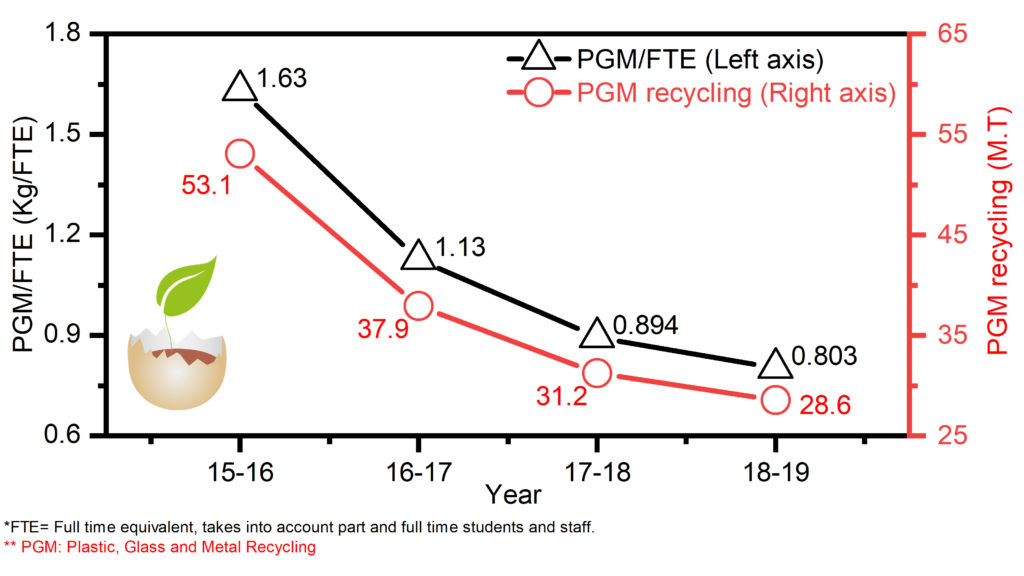
Weight of PGM waste (Paper, glass, metal) collected in absolute values and normalized by population at Concordia University
Weight of paper recycled and number of sheets printed at Concordia University
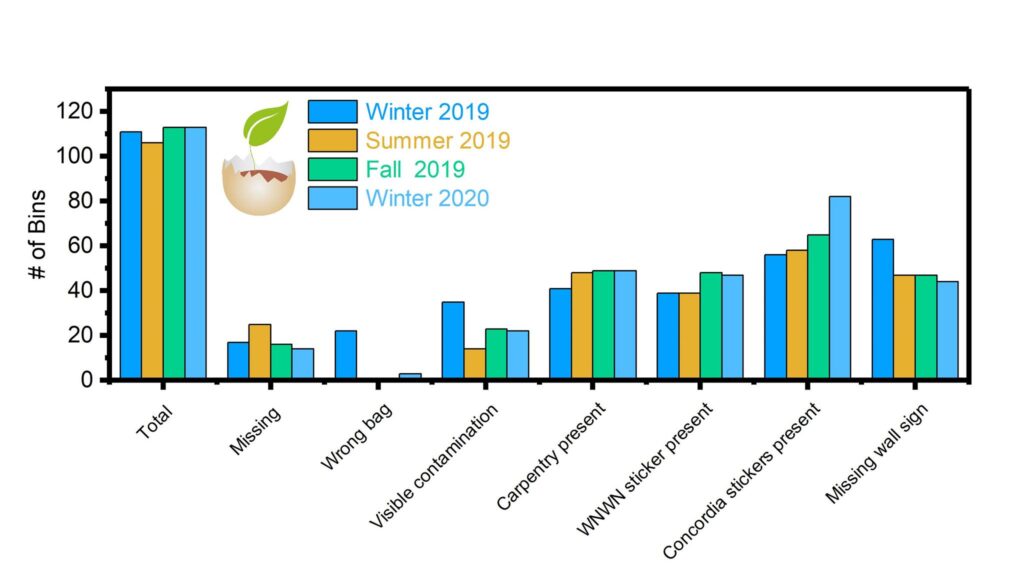
Overview of compost bin signage and contamination
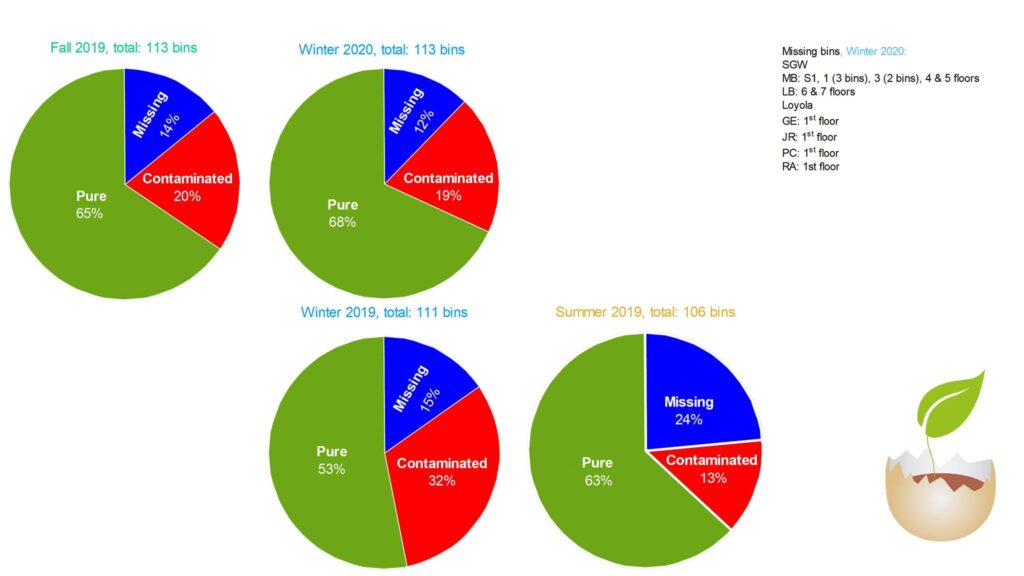
Missing bins and contamination data
DOWNLOADS
LATEST RAW DATA ON WASTE STREAMS
LATEST RAW DATA OF QUALITY CONTROL TOURS
STARS DATA FOR CANADIAN UNIVERSITIES*
*On average, Canadian universities graduate 37% of their students out of programs with sustainability content. But- only 8.5% of Concordia graduates are exposed to sustainability content in their curriculum.
All data is compiled by Waste Not, Want Not.
Menu